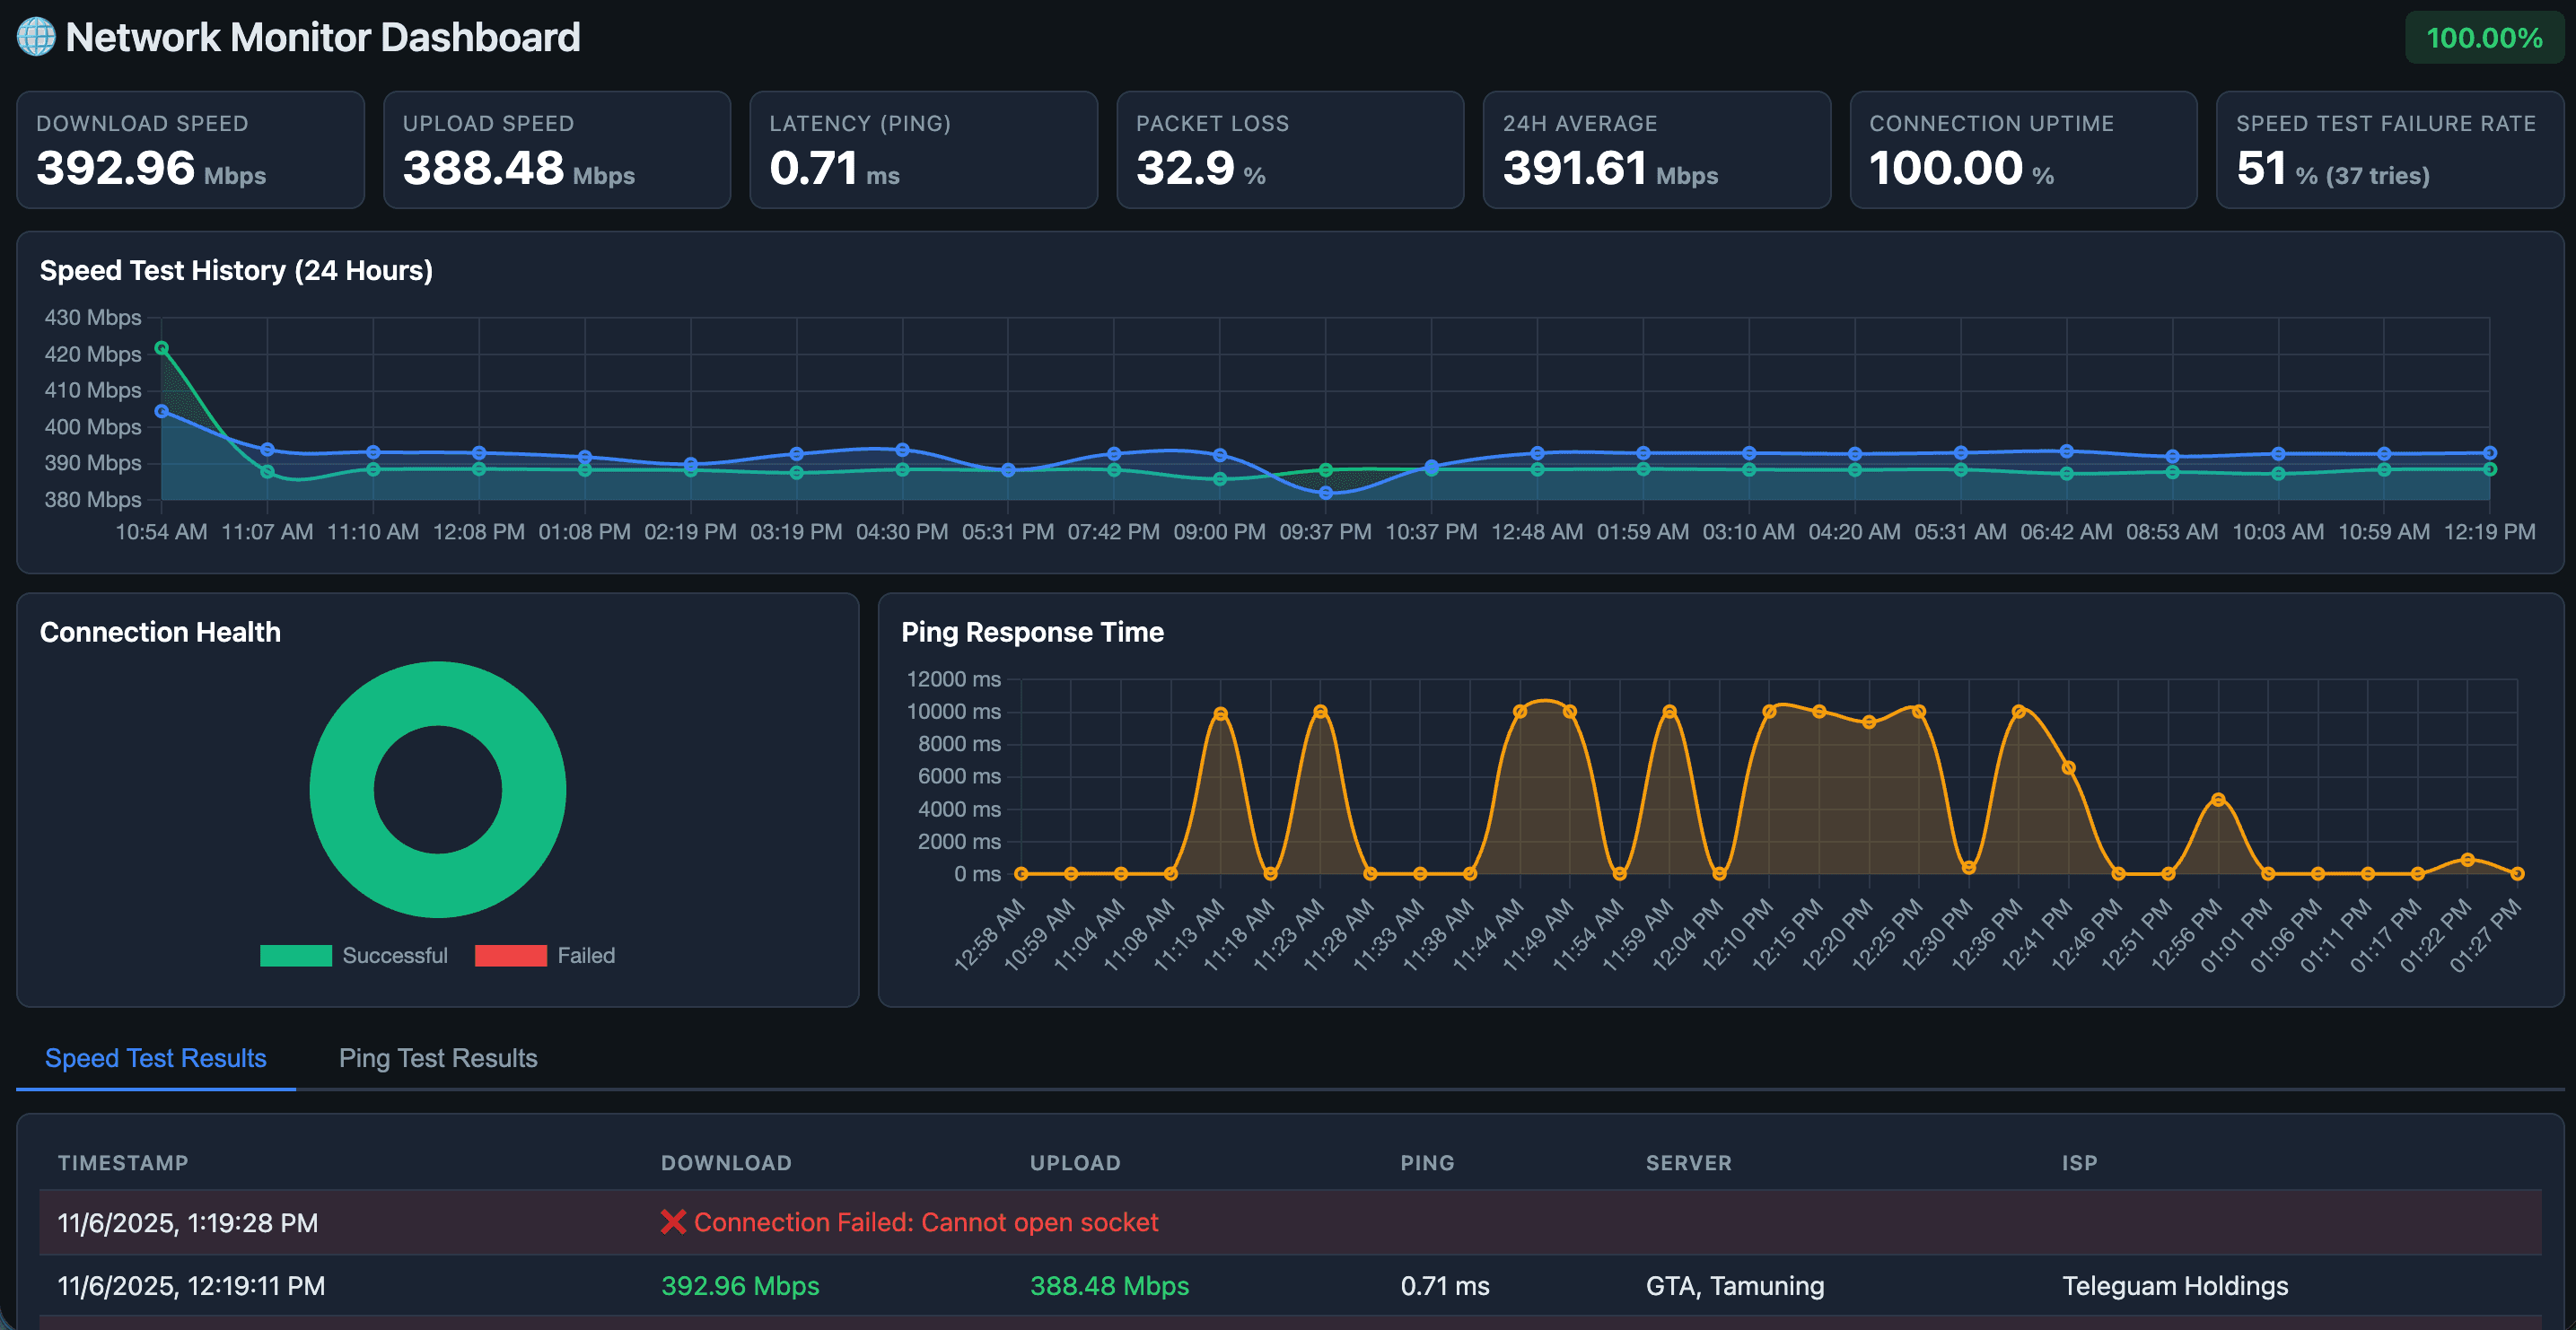
The Problem: Lag Without Proof
Like many of us working from home, I started noticing something frustrating: apps would load with noticeable lag, websites would sometimes fail to load entirely, and video calls would occasionally stutter. The kind of intermittent issues that make you question whether it's your network, the service, or just your imagination.
After 20+ years in software development, I've learned one fundamental truth: you can't fix what you can't measure. And more importantly, you can't have a productive conversation with technical support when your evidence is "things feel slow sometimes".
I needed data. Real, timestamped, verifiable data that I could bring to the tech support team.
Why Build Instead of Buy?
My first instinct wasn't to build something custom. There are plenty of network monitoring tools out there, but a few constraints specific to my environment led me down the DIY path:
- Always-on requirement: I needed continuous monitoring, but didn't want to keep my laptop running 24/7.
- Existing infrastructure: I already had a Raspberry Pi running Pi-hole for ad blocking.
- Lightweight footprint: The Pi was handling DNS duties; I needed something that wouldn't compete for resources.
- Specific data needs: I wanted both speed tests (to measure bandwidth) and ping tests (to detect connection failures).
The Raspberry Pi's resource constraints mandated a purposeful, minimal design.
The Right Tool for the Job: Docker Compose
I settled on a Docker-based solution with three separate containers running on the Raspberry Pi:
- Dashboard container: Flask web server displaying results in real-time.
- Speed test container: Runs Ookla's speedtest CLI every hour.
- Ping test container: Tests connectivity every 5 minutes.
Why Docker Compose with Separate Containers?
This separation wasn't accidental over-engineering; it provided crucial operational benefits on a lightweight host like the Raspberry Pi:
- Failure Isolation: When a network speed test fails (which happens during outages), the dashboard stays up and continues serving historical data. Each component can crash and restart independently.
- Resource Management: Speed tests are network-intensive but short-lived. The dashboard is a long-running web server with different resource needs. Docker efficiently manages these different resource profiles.
- Log Clarity: Logs are segmented (e.g.,
docker-compose logs speedtest-cronvs.docker-compose logs speedtest-monitor), which is invaluable when debugging a network failure at 2 AM.
Implementation Decisions
Data Storage: SQLite
For this time-series use case, SQLite was the perfect choice:
- Zero-configuration (no database server to manage).
- Lightweight (minimal memory footprint).
- Persistent (survives container restarts).
The database stores every test result, including failures (with download=0) to maintain time-series continuity and allow analysis of complete connection outages.
The Importance of Failure Handling
This was critical for generating actionable evidence. The monitoring tool must record that it's failing when the network is down.
The script carefully:
- Correlates speed test failures with ping tests to distinguish "slow network" from "connection is down".
- Stores a record with
download=0and the error message on failure.
This distinction matters when talking to ISP support: "My connection was completely down for 15 minutes at 3 AM, here's the ping data" is actionable proof, unlike a vague complaint.
Lessons for Technical Leaders
This hands-on project, though small, reinforced important leadership principles:
- Stay hands-on: The ability to quickly prototype solutions keeps your technical instincts sharp.
- Measure before escalating: Support teams respond better to data than complaints. "I have 48 hours of test data showing 15% packet loss" beats "my internet feels slow".
- Right-size your solutions: This isn't a Kubernetes cluster with Prometheus and Grafana. It's SQLite, Flask, and Docker Compose. Use the minimal technology required to solve the problem efficiently.
Conclusion
Sometimes the best tool is the one you build yourself—not because existing solutions don't exist, but because your requirements and constraints are specific and real. For a lightweight, reliable, and verifiable monitoring solution on a Raspberry Pi, Docker Compose, Flask, SQLite, and the Ookla CLI were the perfect, minimal stack.
Now, with 48 hours of continuous data, I have the evidence needed for a productive conversation with tech support. Measure, then act.
Update [as of 2025-11-12]
After presenting GTA's support team with the 48 hours of verifiable data—which showed average packet loss at 21% (last 24 hours) and peaks of up to 80%—the technician was able to diagnose and resolve a backend network issue.
The outcome was immediate and dramatic:
- Packet Loss: Dropped from an average of 21% to less than 1%.
- Latency: Significantly improved, resulting in a noticeably smoother experience across all applications.
I will continue to monitor the network to ensure the solution remains permanent.